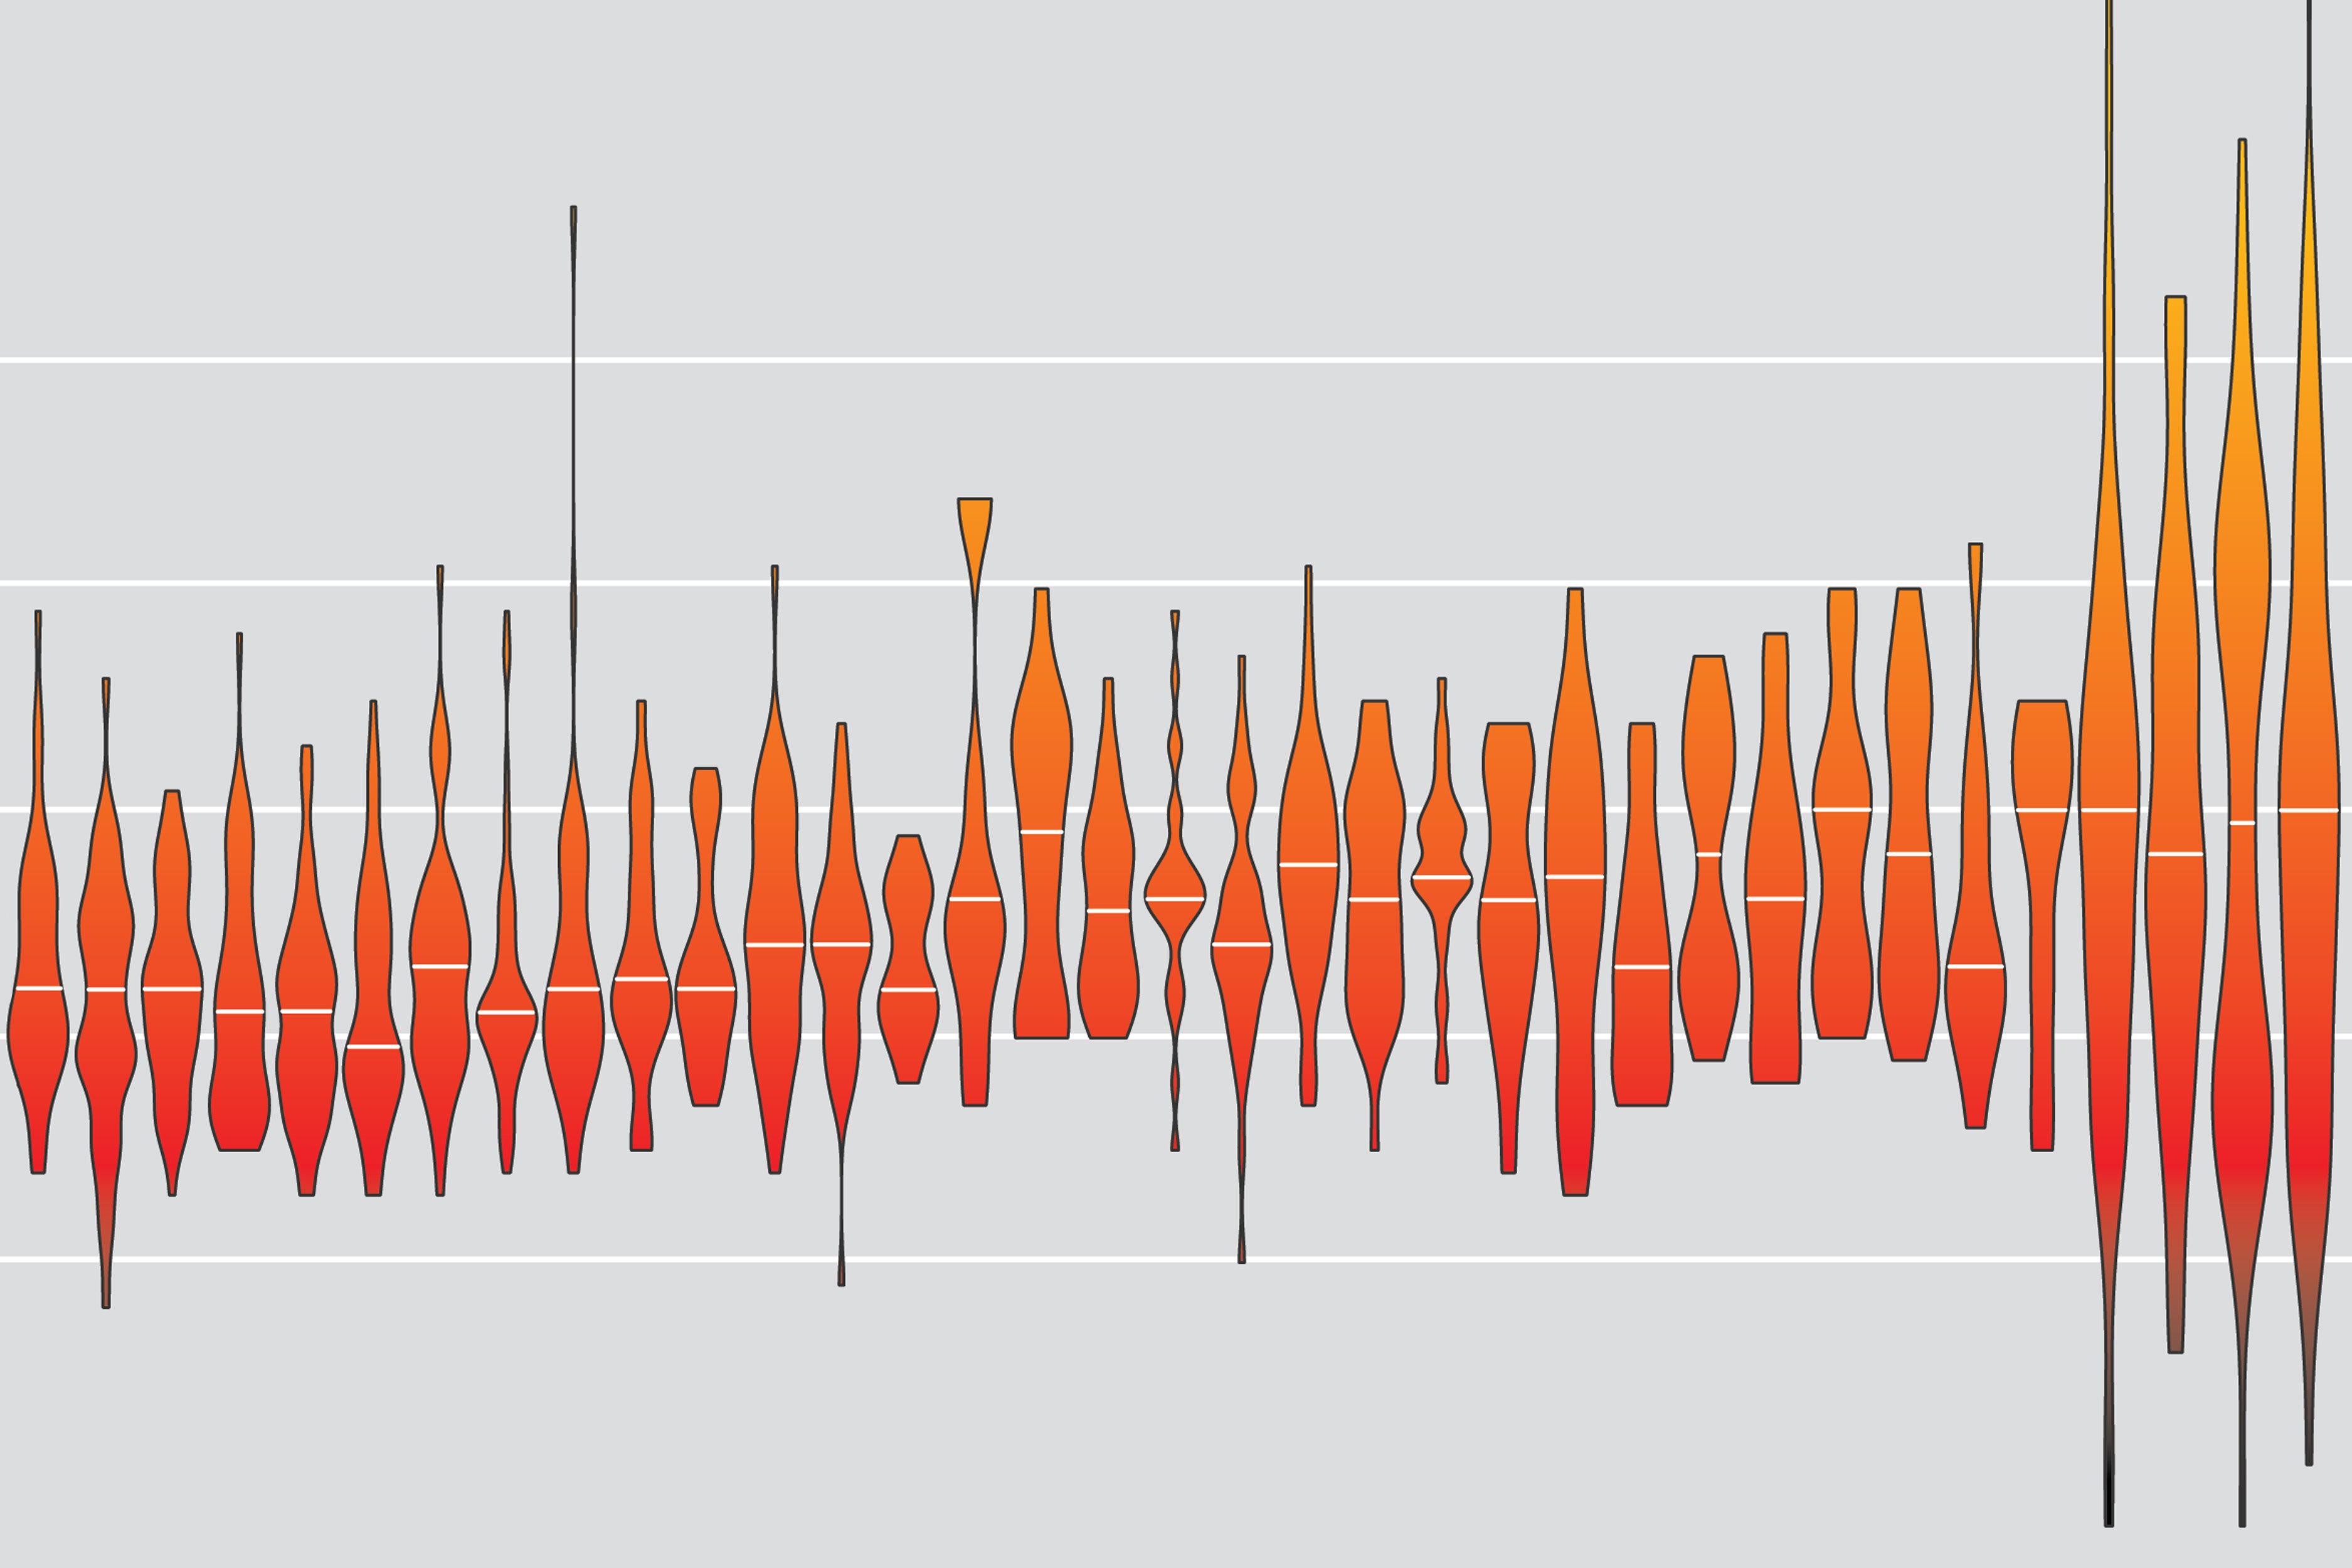
Detail of a violin chart shows the median going up over time and the range getting larger over time.
2025-01-21 393词 简单
The ages of astronauts are shown here for each year when people flew to space. The width of each blob represents the number of fliers for each age. Both the average age of astronauts and the spread in ages have gradually risen over time.
免责声明:本文来自网络公开资料,仅供学习交流,其观点和倾向不代表本站立场。